
Chad, Africa · Mobile nitrogen
Chad mobile oilfield nitrogen project
The project record lists one QMD200/95 nitrogen truck with a design capacity of 200 Nm³/h for mobile oilfield supply.
01 / CONTEXT
Project overview
The project record lists one QMD200/95 nitrogen truck with a design capacity of 200 Nm³/h for mobile oilfield supply.
02 / PROBLEM
Operational challenge
Work locations move frequently, while heat, road vibration, fuel or power availability and service access determine real-world uptime.
Vehicle integration, rapid deployment, ambient temperature, energy supply, vibration and service access.
03 / ENGINEERING
Engineered solution
A truck-mounted QMD200/95 integrates gas treatment, generation, controls and buffer capacity, engineered for fast deployment, relocation, vibration resistance and thermal management.
Mobile integration supports faster deployment with remote engineering and critical spares.
04 / VALUE
Project value
Nitrogen production travels with the operation. Value comes from both the gas-price spread and avoided transport waiting and production downtime.
PROJECT RECORD
A project record from system configuration to operational handover.
The record follows three evidence lines: configuration, manufacturing and integration, then installation and commissioning. Images come from existing equipment, integration or commissioning records; text is tied to the confirmed location, industry, model and quantity.
Engineering record
System configuration and scope
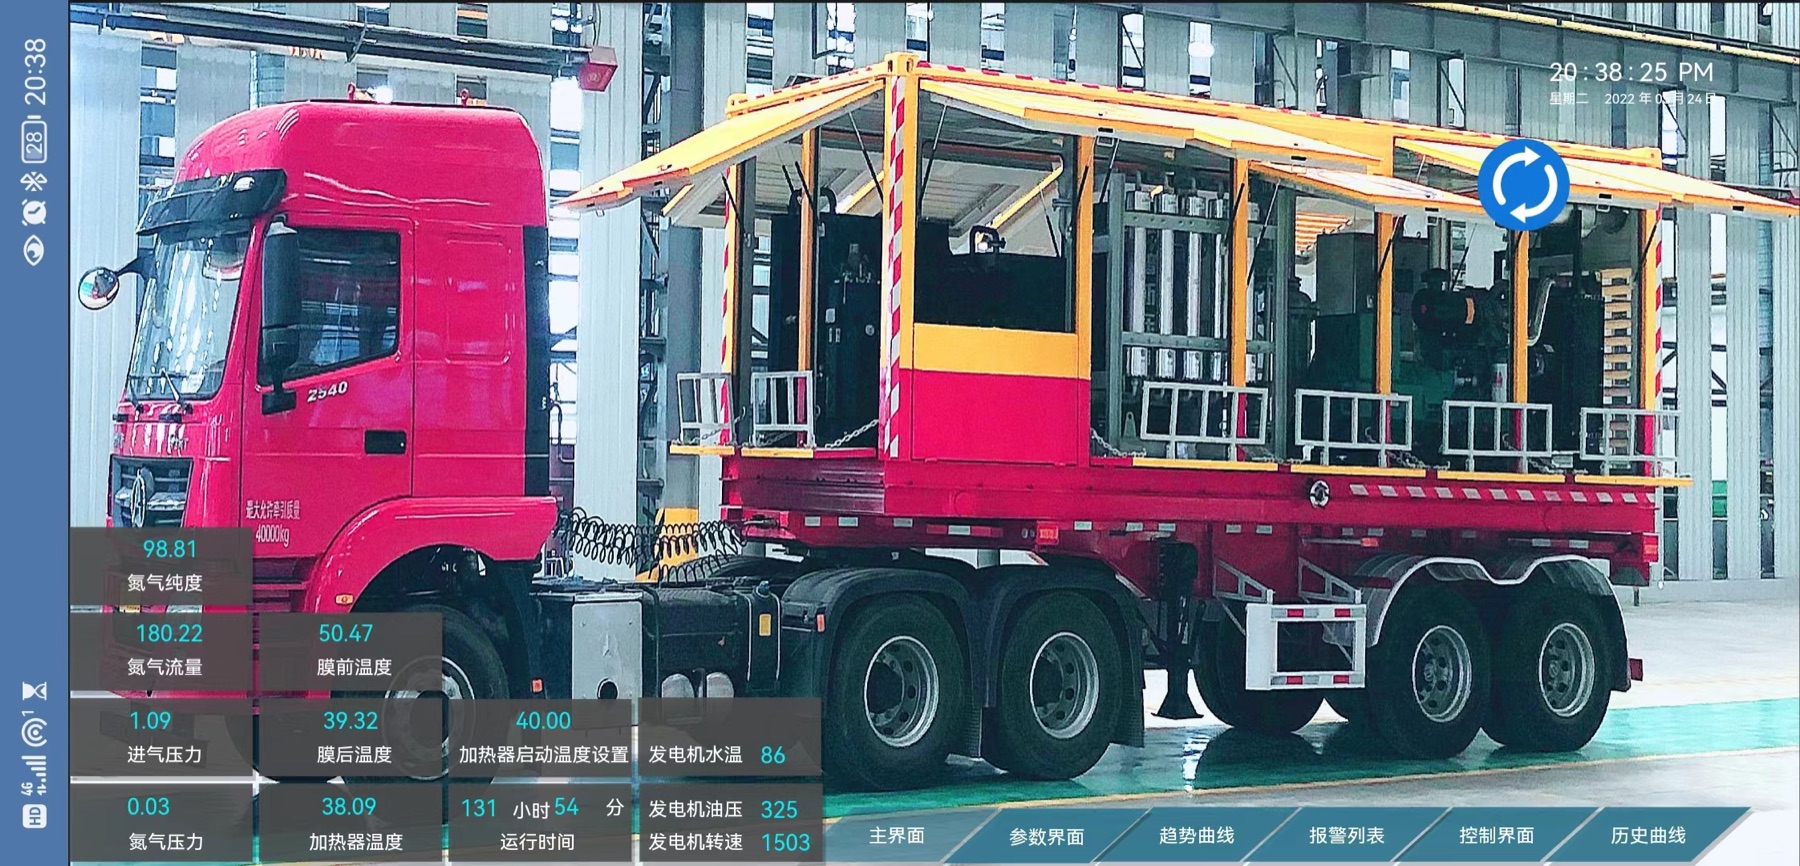
The model, quantity and duty define the nitrogen unit, buffer storage, online analysis, controls and safety protection as one complete system.
A truck-mounted QMD200/95 integrates gas treatment, generation, controls and buffer capacity, engineered for fast deployment, relocation, vibration resistance and thermal management.
Engineering record
Manufacturing, integration and factory checks
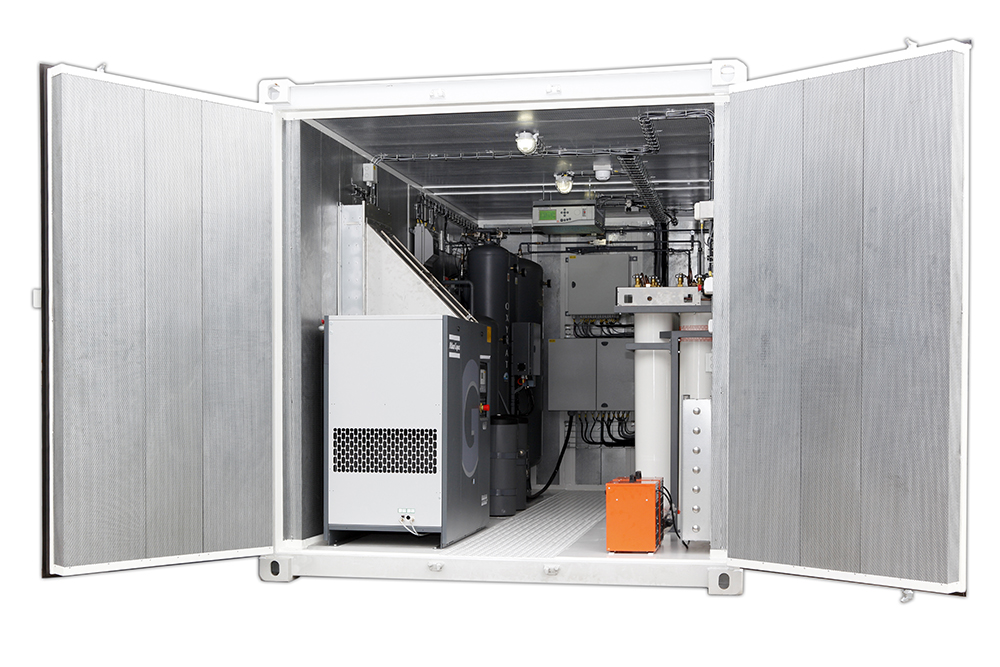
Assembly, piping, electrical inspection and system testing follow controlled drawings. Packing, lifting, logistics and interfaces are reviewed for remote projects.
Mobile integration supports faster deployment with remote engineering and critical spares.
Engineering record
Commissioning and operational handover
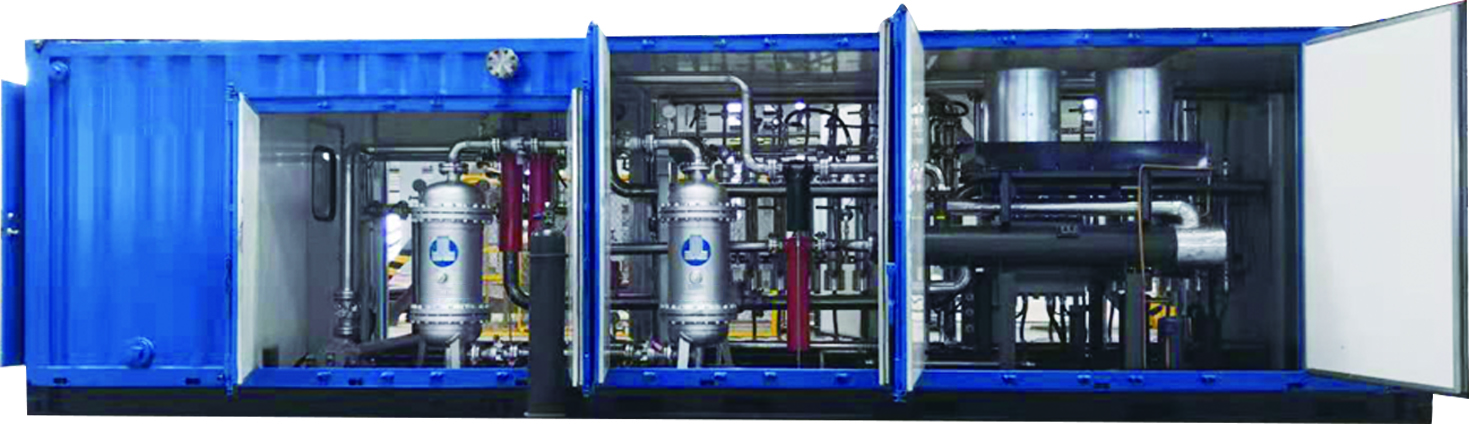
Site work proceeds through hook-up, energisation, individual checks, integrated start-up, purity and flow verification, operator training and handover.
Nitrogen production travels with the operation. Value comes from both the gas-price spread and avoided transport waiting and production downtime.
PROJECT DELIVERY
From duty confirmation to stable production
Technical boundaries, delivery responsibilities and acceptance criteria are defined early to prevent interface rework on site.
- 01
Duty analysis
Confirm flow, purity, pressure, dew point, operating hours, peaks and current gas cost.
- 02
Engineering and tender
Define scope, select equipment, model energy use and support technical tender documents.
- 03
Detailed design
Confirm utilities, interfaces, controls, safety interlocks, civil works and piping.
- 04
Manufacturing and inspection
Build to controlled drawings and inspect key components, assembly, leakage, electrical and performance.
- 05
Logistics and installation
Coordinate packing, transport, lifting, piping, power and site readiness.
- 06
Commissioning and acceptance
Complete checks, integrated start-up, purity and flow verification, training and acceptance records.
- 07
Production and warranty
Track operating data and maintenance, with one-year contractual warranty and remote support.
ECONOMICS
Return-on-investment model
Model, quantity and design capacity come from the project record. The table uses only the provided RMB 0.35/m³ on-site cost and RMB 0.90–1.20/m³ delivered price to calculate an auditable annual cost spread.
| Delivered unit price | Annual delivered cost | Annual on-site cost | Annual cost spread |
|---|---|---|---|
| RMB 0.90 / m³ | RMB 495,000 | RMB 192,500 | RMB 302,500 |
| RMB 1.05 / m³Midpoint scenario | RMB 577,500 | RMB 192,500 | RMB 385,000 |
| RMB 1.20 / m³ | RMB 660,000 | RMB 192,500 | RMB 467,500 |
FORMULA
Full calculation
- Annual volume = design capacity × planned load × annual operating hours
- Annual delivered cost = annual volume × delivered nitrogen price
- Annual on-site cost = annual volume × RMB 0.35/m³
- Annual cost spread = delivered cost − on-site cost
- Annual net saving = cost spread − electricity adjustment − maintenance − finance and tax
- Simple payback = total tax-inclusive investment ÷ annual net saving; 5-year ROI = [5 × annual net saving − total investment] ÷ total investment × 100%
Contract value and actual customer gas bills are not public, so this page does not invent investment, payback or ROI. Provide total investment, local power price, operating hours and maintenance budget for a formal calculation.